iOS / macOS app
CoreBeat
Version 1.1.0 for iPhone and iPad is available in supported App Store regions. Also available for Apple Watch. The Mac build was submitted for review.
A device status app for CPU, memory, network speed, heat, battery and storage. Version 1.1.0 for iPhone and iPad is available in supported App Store regions, with a customisable dashboard, device check history, PDF reports and longer network stability tests. Also available for Apple Watch.
Overview
- Four platforms — iPhone and iPad share one universal app with home and lock screen widgets, Control Center buttons and Siri shortcuts, Apple Watch shows the watch's own status with watch face complications, and the Mac version lives in the menu bar and sends an alert when the CPU stays busy, memory gets tight or storage runs low; a separate direct-download build adds temperatures and fans, a process ranking, SSD wear and a cable-based iPhone check
- Battery health import reads cycle count, maximum capacity and temperatures from the system's Analytics Data, filling in what iOS doesn't give apps directly; the one-tap check-up scores battery, storage, heat, memory and CPU and suggests fixes
- Find out why the network is slow — it checks the phone-to-router hop, DNS, whether a Wi‑Fi login page is in the way, and nine everyday sites at home and abroad, then explains the result in plain words; it also tracks monthly cellular data and warns before you go over your plan
- On iPhone and iPad, rearrange dashboard cards, test sustained performance, compare Wi-Fi by room and review saved device checks
- Type
- iOS / macOS app
- My role
- Design · development
- Date
- 2026.10
- Status
- In progress
- Privacy policy
- Privacy policy
Screenshots
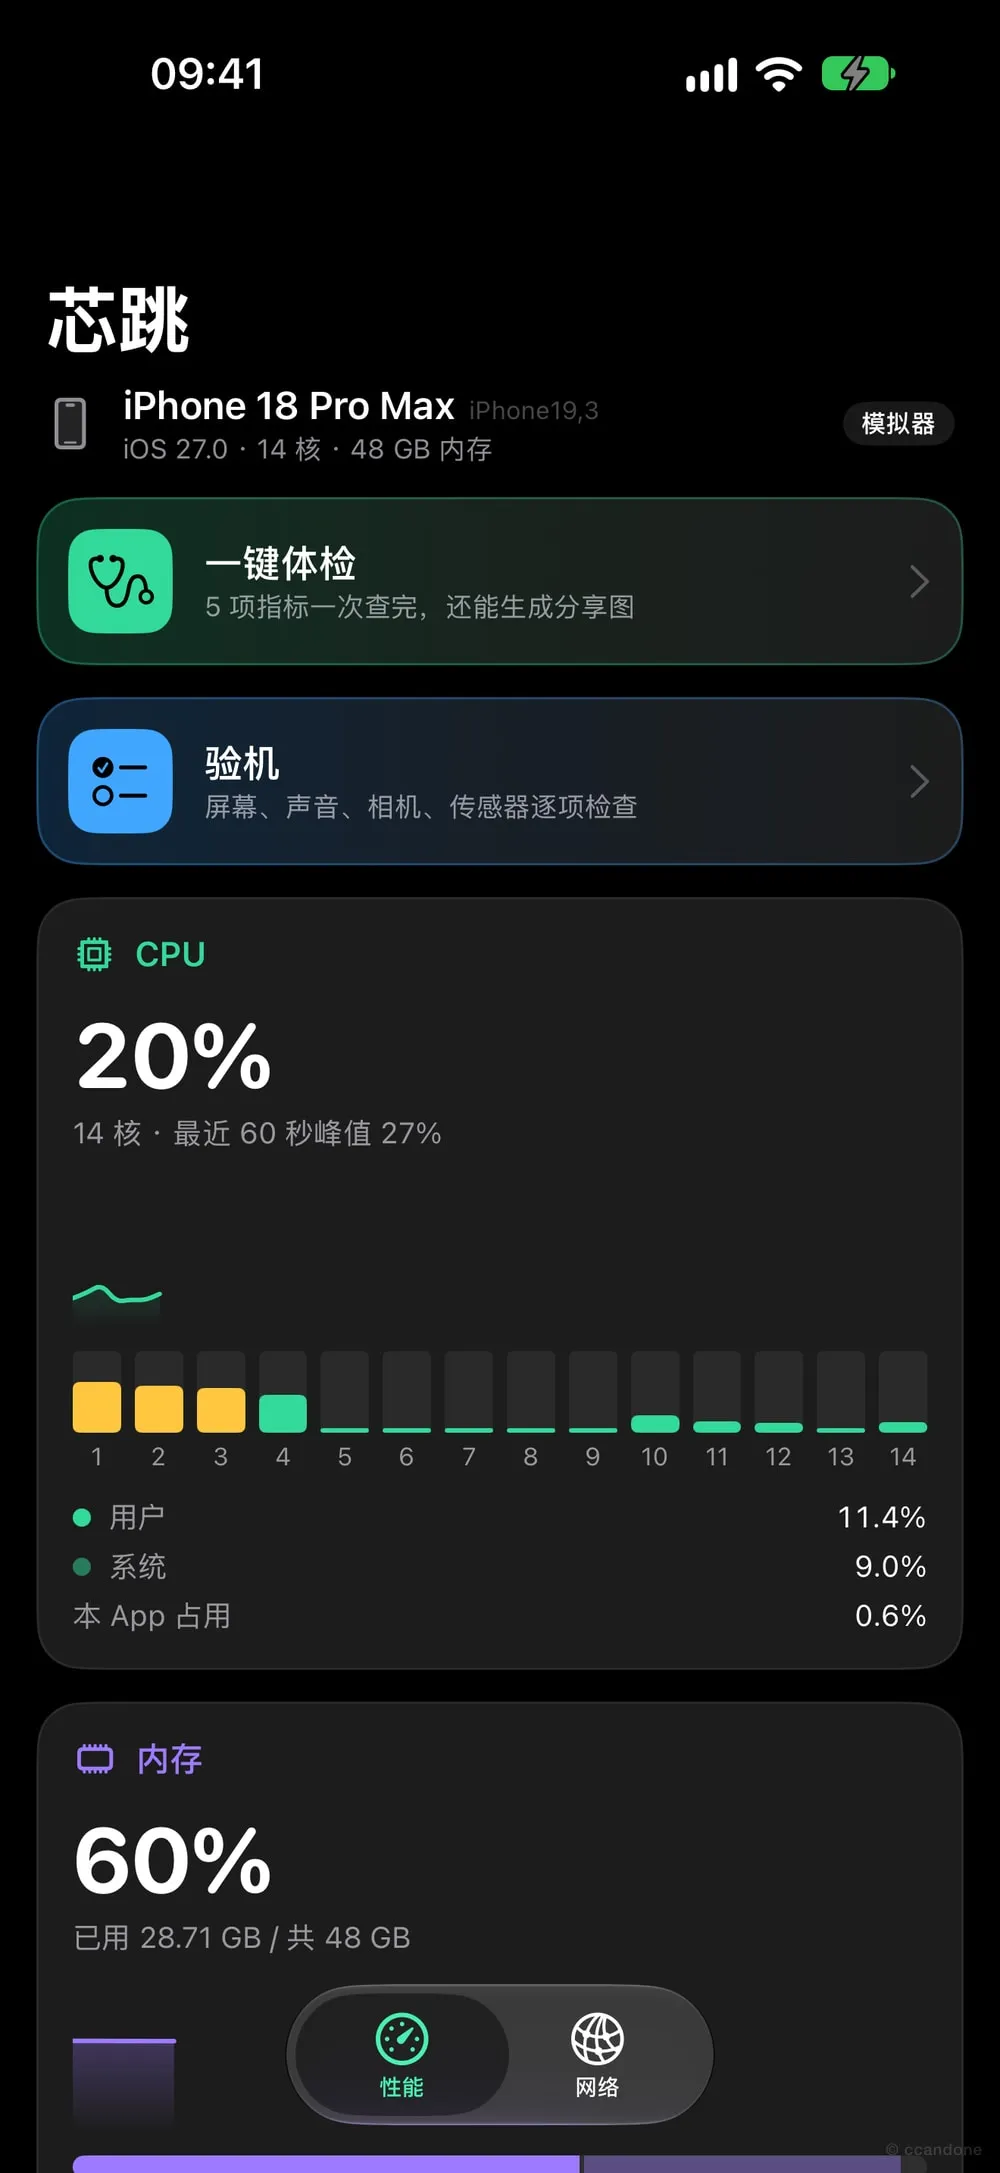
Performance: load on every CPU core and the last 60 seconds 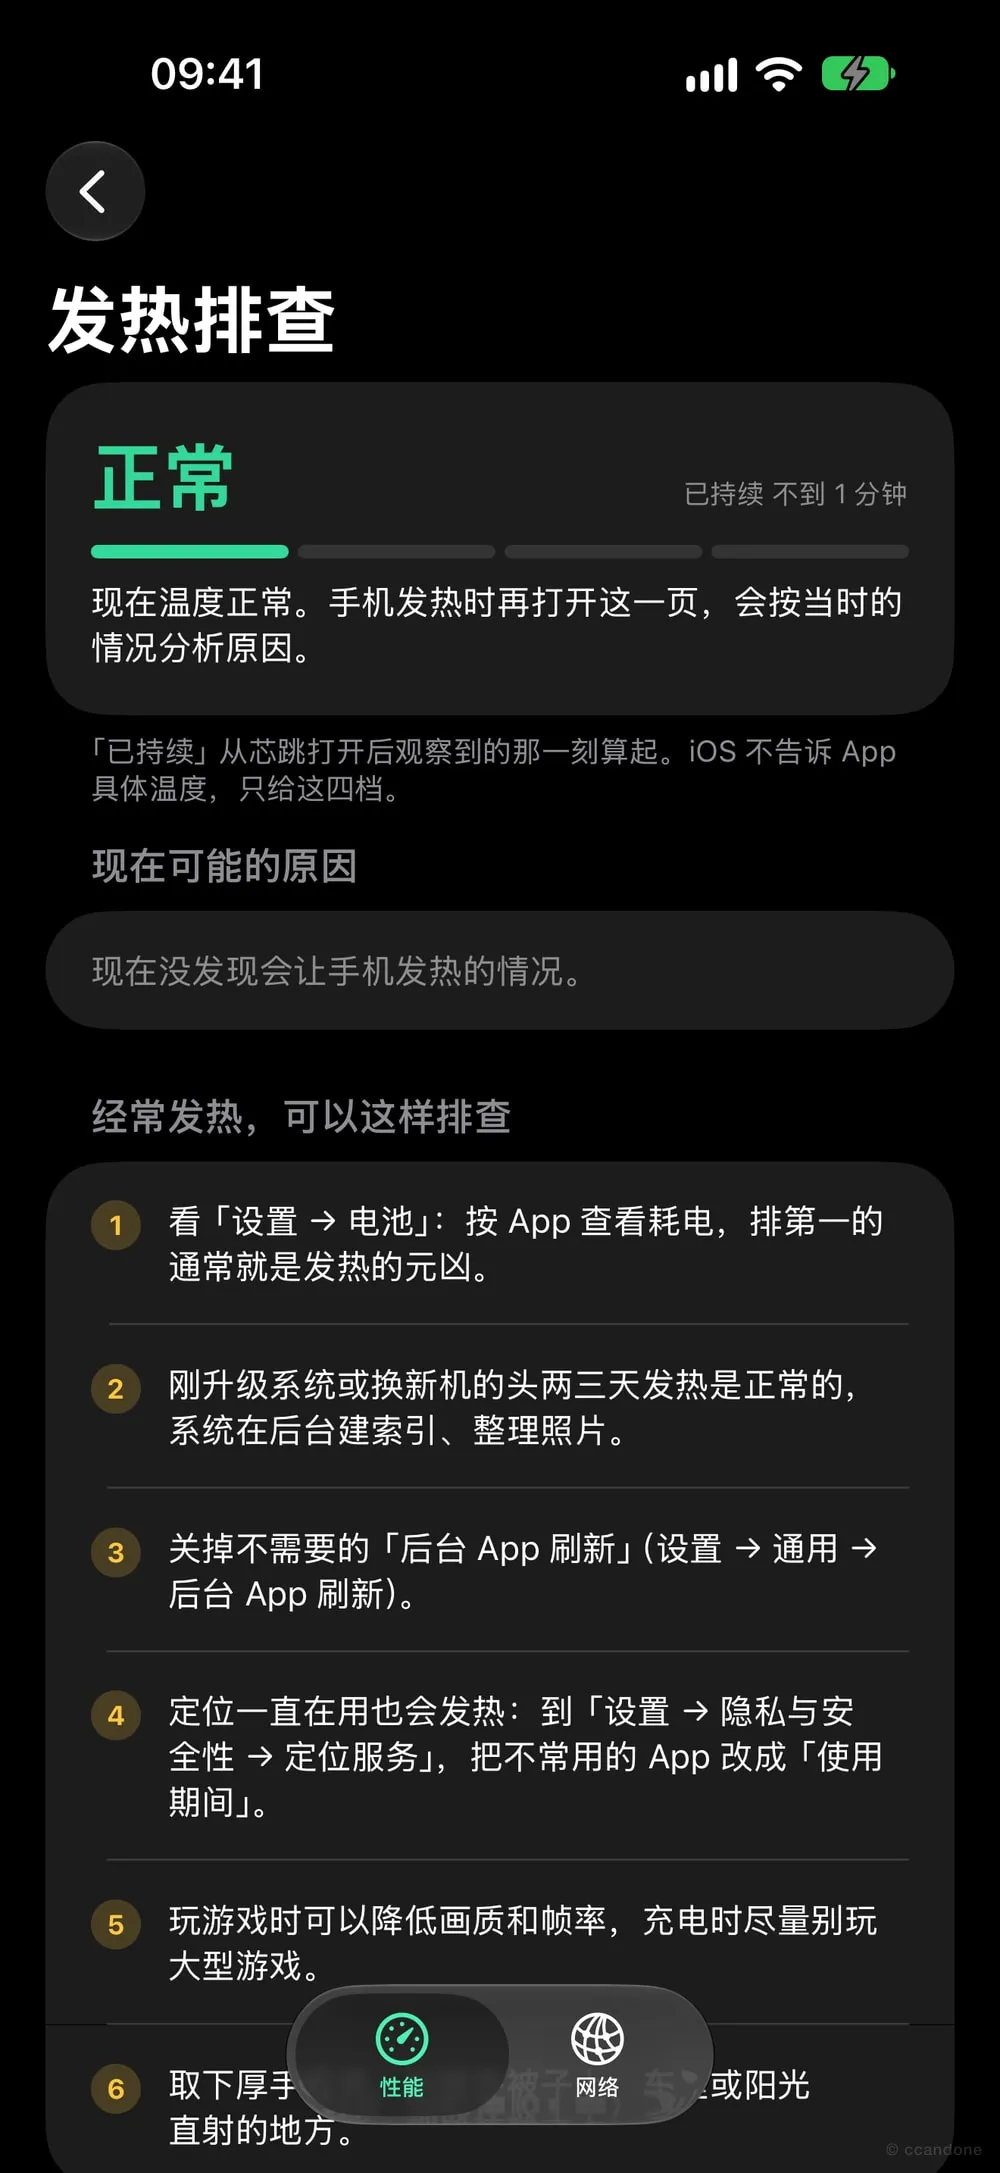
Heat check: likely causes from the current readings, then a checklist 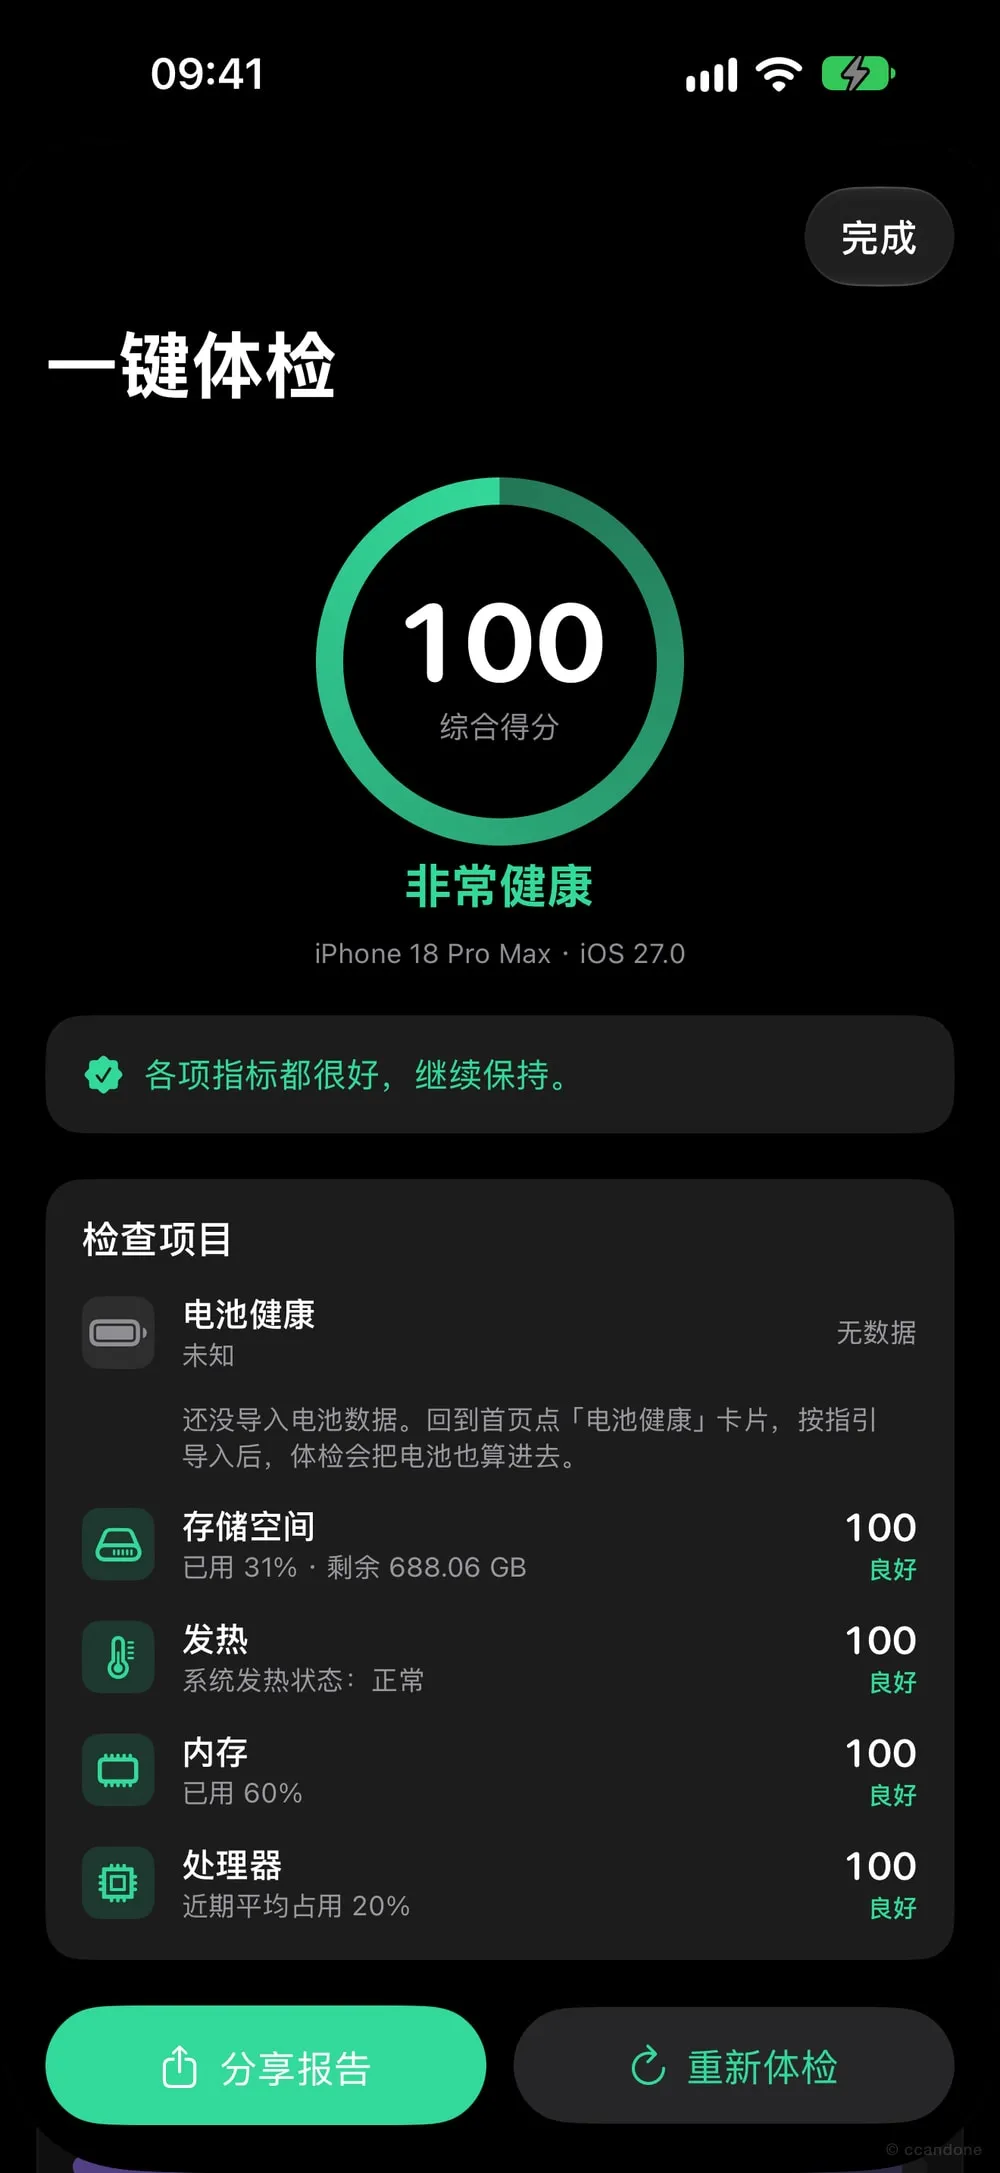
One-tap check-up: five scores and what to do about them
Screenshots from the iOS Simulator. Tap one to see it full size.
Why I’m building it
When my phone gets hot, slow, or the network crawls, I want to see what’s actually going on. Similar apps on the App Store are either full of ads or ask for a pile of permissions. So I’m making my own: open it and look, with a clean interface and no data collected.
It soon grew past the phone to iPad, Apple Watch and Mac, so “Phone Status” became CoreBeat (芯跳 in Chinese, a pun on “heartbeat”): the beat of the device’s core.
What it shows
iPhone / iPad
- CPU: overall usage, usage per core, and how much the app itself is using.
- Memory: how much is in use, cached, free and compressed, plus the app’s own memory.
- Network: live upload and download speed over Wi‑Fi and cellular, plus today’s Wi‑Fi data and this month’s cellular data.
- Thermal state: the four levels the system reports (normal / warm / hot / too hot), each with a short explanation.
- Battery: charge level, whether it’s charging, whether Low Power Mode is on, and how fast it’s charging or draining right now (estimated from the level, such as “charging about 1.5% a minute”); with an import, also health and cycle count.
- Storage: total capacity, free and purgeable space, how much the app itself takes up, and tips for clearing space when it runs low.
- Heat check: tap the thermal card for the likely causes based on the current readings (charging, a busy CPU, a big download, being on cellular, a low battery) and six common things to check; the home screen shows a banner when it’s hot or too hot.
Everything is sampled once a second, with a chart of the last 60 seconds for CPU, memory and network speed. The top shows the device’s product name, such as iPhone 13 or iPad Pro. On a wide iPad screen it switches to two columns, in either orientation and in Split View.
The Network screen lists the current Wi‑Fi name (read only when you tap, as iOS requires precise location for it), the IPv4 / IPv6 addresses, gateway, DNS, VPN and system proxies, plus each cellular line’s network type (5G SA / NSA, LTE…) and which one carries data.
Monthly cellular data: set your billing day and plan size and CoreBeat keeps a monthly tally, which you can calibrate against your carrier’s figure, with a local notification at 80% and 100%. It counts whenever the app is open, a widget refreshes or the system grants some background time; iOS keeps no daily data ledger for apps, so it can only undercount, never overcount, and the screen says so.
Network diagnosis: tap it when the network feels slow and it works through: is there a connection → latency from the phone to the router (needs Local Network permission) → DNS lookups for nine sites, plus a lookup of a domain that doesn’t exist (getting an address back means DNS hijacking) → whether a login page is in the way (via Apple’s captive.apple.com) → a few connections each to Baidu, WeChat, Taobao, Douyin, Apple, iCloud, Google, GitHub and YouTube for latency, loss and jitter. It ends with one plain sentence on where the slowness is. With a VPN or proxy app on, it notices, switches to a different method and won’t falsely report hijacked DNS.
Charging Live Activity (iPhone): open CoreBeat while charging to see battery level, charging speed and an estimated time to full when available, on the Lock Screen and supported Dynamic Island models. The system keeps an existing countdown running in the background, and readings refresh when you reopen the app. You can turn it off on the charge and drain speed screen.
Widgets: small, medium and large home screen widgets and circular, rectangular and inline lock screen styles, each with a refresh button, plus a single-reading widget you set to CPU, memory, storage, battery or this month’s cellular data. The system refreshes widgets roughly every 15 minutes, and the description says so.
Shortcuts and Control Center: ask Siri for the battery level, free storage or thermal state without opening the app, or use them in your own shortcuts; Control Center (iOS 18 and later) gets buttons for the check-up, speed test and network diagnosis that open straight to that screen.
Apple Watch: the watch’s own battery, thermal state, CPU, memory, storage and network, scrolled with the Digital Crown, plus two watch face complications, Storage and a CoreBeat overview (battery, storage and heat), refreshed hourly.
Hardware check (iPhone / iPad): 17 tests, handy for a second-hand phone or after a drop: dead pixels, touch and multi-touch, speaker, earpiece and microphone, front and rear cameras and flash, vibration, accelerometer, gyroscope, compass, barometer, proximity sensor, volume buttons, Face ID / Touch ID and location. It can make a report image to share that only shows the device model, OS version and each result.
Speed test (iPhone / iPad / Mac): download and upload speed, plus latency to everyday services like Baidu, WeChat, Douyin, Apple, GitHub and Google, going online only when you tap “Start”. View trends, compare results by network and delete records on the device.
Mac: live readings always in the menu bar, where you choose what to show (CPU, memory, network speed, temperature, battery, disk activity), a small panel when you click it, and a dashboard window with the chip’s performance and efficiency cores, GPU usage, memory pressure, swap, battery cycle count, health and more.
- Disk: live read and write speeds with a chart, used / purgeable / free space, the drive model, file system and total reads and writes since startup. The direct-download build also reads the SSD’s remaining life, total data written and power-on hours.
- Alerts: a system notification when the CPU stays busy, memory pressure gets tight, storage is nearly full or the system throttles to cool down (plus a CPU temperature alert in the direct-download build). A condition has to last a while before it alerts, alerts of the same kind have a cooldown, and the switches and thresholds are in Settings, with a test notification.
- Process ranking (direct-download build): child processes grouped under their app, sorted by CPU or memory, with each one’s subprocesses and threads a tap away; the menu bar panel shows the top three.
- History: an average saved every minute and kept for 7 days, with charts for the last hour, 24 hours and 7 days, to find when the Mac slowed down and which app did it. The dashboard window switches between Live, History and Speed test.
- Power and accessories: where macOS provides the readings, the battery card and menu bar panel can show system power draw, battery charging or discharging power and the battery levels of connected Bluetooth accessories. Low accessory batteries can trigger a local alert.
- Hardware and parts: who made the memory and flash chips and the battery cells, the fuel gauge chip, design capacity, charger, Wi‑Fi and Bluetooth chips, display and Thunderbolt, plus the sales region from the model number and the Activation Lock state.
- iPhone check (direct-download build): connect an iPhone over a cable for a read-only look at battery cycles and true health, live charge and drain power, flash maker and capacity, the model number (refurbished, replacement or display unit), activation state, whether it’s supervised or managed by an organisation (MDM), production or engineering unit, whether each camera module is recognised, panic and app crash counts, plus the chip, board, baseband and SIM. It’s handy when buying a used iPhone and can make a report image. It changes nothing on the phone, and doesn’t show the serial number, IMEI, phone number or app names.
- Launch at login: one switch in Settings.
- The release build uses about 1.2% CPU while sitting in the menu bar: the charts are drawn by hand, and temperatures and processes are sampled every 3 seconds. The dashboard stops drawing once its window is closed, minimised or covered for 30 seconds, and the view only updates when a reading changes.
- Traffic counts: the system’s per-interface counters are 32-bit and restart from zero after 4 GB, which throws many tools off. CoreBeat adds them up per interface and spots the wrap-arounds, and the Mac shows traffic since CoreBeat started.
Battery health import
iOS doesn’t let apps read battery health or cycle count, but every day the system writes a log under Settings → Privacy & Security → Analytics & Improvements → Analytics Data that contains those numbers. Share the latest log with CoreBeat (or import it from Files, or paste it) and it reads the cycle count, maximum capacity, current full-charge capacity, and average and peak temperature on the device. It keeps only those few numbers, and several imports draw a chart of how they change.
With two imports at least a month apart, it also works out how fast the battery is ageing: the drop per month and per 100 cycles, and roughly which month it will reach 80%. The home screen reminds you to import again after 30 days.
One-tap check-up
It scores five areas (battery health, storage, heat, memory and CPU, plus disk health in the Mac direct-download build) into an overall score and a verdict from “very healthy” to “needs attention”, with a concrete tip for each weak spot. The report can be shared as an image that only shows the device model, OS version and scores, with no addresses.
Toolbox and dashboard in 1.1.0
The Toolbox gives device checks, battery tools and network tests one place to live. The stability test runs a fixed workload for 1, 3 or 5 minutes and graphs throughput and the system thermal state. The network quality map compares response times and a small download across rooms you name yourself. Both tools keep a local history. Network Stability Tests run for 1, 3 or 5 minutes and record response times and connection changes. Compare saved device checks on the device or export a PDF. Dashboard cards can be reordered, with a Compact mode and 1-, 2- or 5-second refresh intervals.
The Mac App Store build can also open an iPhone analytics log to show battery health. Its report stays in memory until you clear it or quit.
What Apple’s platforms allow
To get onto the App Store, the app only uses Apple’s public APIs, so some data is out of reach: CPU temperature, signal strength, carrier name, and identifiers like the phone number. The app says so plainly and shows the system’s four-level thermal state instead of a temperature, with nothing faked or guessed. iOS suspends apps in the background, so there’s no continuous background monitoring either; only the monthly cellular tally uses the occasional background time the system grants.
The Mac App Store version runs in a sandbox, which blocks the temperature sensors and the disk’s SMART data and hides other apps’ processes. So the Mac app comes in two builds: the App Store one leaves that code out entirely and offers a button to open Activity Monitor instead of the process list, and the direct-download one runs outside the sandbox and adds “Temperatures & fans” (CPU, GPU, SSD and battery temperatures and fan speeds), SSD health, the process ranking and the iPhone check.
Privacy
- Every reading is worked out on the device and never uploaded or stored on a server; the privacy manifest declares that no data is collected.
- Public IP lookup, speed tests and network diagnosis contact their respective services when you start them. The network quality map and longer network stability test contact Cloudflare’s test server when started. Room labels and measurement history stay on the device.
- The Wi‑Fi name needs precise location permission (an iOS rule) and is only requested when you tap; the location isn’t saved or uploaded. The monthly data tally and its settings stay on the phone, shared only with the app’s own widgets.
- The most recent 100 speed test records stay on the device for trends and network comparisons. On iPhone or iPad, the Wi‑Fi name may be kept with the result if the app already has permission. You can delete the records.
- An eye button at the top right of the Network screen hides every address in one tap, so screenshots don’t give away your IP.
- The battery log is only read on the device, and the page points out that “Share iPhone Analytics” sends anonymous data to Apple, so you can turn it off again after importing.
- The iPhone check only works over a cable, reads without saving anything, and shows the results only on that Mac.
- The hardware check uses a camera preview and checks GPS accuracy. Audio is temporarily written for playback and cleaned up after the check. None of these test inputs are uploaded.
- The Mac’s alerts are local system notifications, and the process list and disk data are only read and shown on that Mac, never stored; history stays on that Mac and anything older than 7 days is deleted.
Tech
- Swift and SwiftUI, Swift Charts for the charts, WidgetKit for the widgets, iOS 17 and later, always dark.
- Every string in the interface lives in one String Catalog, in Chinese and English following the system language; the device model table is generated from the device description files that ship with Xcode.
- The samplers and UI components are shared by all four platforms. CPU and memory come from Mach APIs, network speed from the interfaces’ byte counters, network details from the Network and CoreTelephony frameworks, and DNS servers through libresolv.
- The Mac direct-download build has two small C modules, one reading temperatures and fans from the SMC and one reading the NVMe drive’s SMART health data, compiled into that build only. The iPhone check has its own usbmux and lockdown client, using the existing trust pairing between the Mac and the phone to read diagnostics, in that build only too.
- The Xcode project is generated from a config file with XcodeGen, which keeps it easy to maintain.
- The app icon is a ring in three segments (green for CPU, violet for memory, blue for network), matching the colours in the app.
Progress
- Performance dashboard and Network screen, checked against a real iPhone
- App icon, home and lock screen widgets
- Apple Watch app, Mac app (App Store and direct-download builds)
- iPad layout
- Renamed to CoreBeat
- Battery health import and one-tap check-up
- Mac alerts, process ranking, disk card and SSD health
- Chinese and English, device model names, launch at login on the Mac
- Hardware check, speed test, Mac history and a customisable menu bar
- Mac hardware and parts card, iPhone check in the direct-download build
- Battery ageing, charge and drain speed, network diagnosis, heat check, Siri shortcuts and Control Center buttons
- Uploaded to TestFlight
- Monthly cellular data, more widgets, watch face complications, the Wi‑Fi name, Mac GPU usage and lower overhead, and a fix for traffic counts resetting after 4 GB
- Speed test history, charging Live Activity on iPhone, Mac power draw and Bluetooth accessory batteries
- Prepared App Store listing copy and screenshots
- iPhone, iPad and Apple Watch launched on the App Store in supported regions; Mac build submitted for review
- Version 1.1.0 shipped for iPhone and iPad, adding the Toolbox, dashboard controls, device check history and network stability tests. App Store (US)
- Verify Apple Watch, charging Live Activity and Bluetooth accessory battery readings on real devices
- Publish the Mac App Store build and prepare a signed and notarized direct download
- Ideas for later: device performance history on iPhone, a large widget on iPad